What is a Workflow Diagram and How Do You Create One?
Visualizing a process will help you better understand how your business functions. This article will cover workflow diagrams from top to bottom with five steps to creating your first diagram.
What is a workflow diagram?
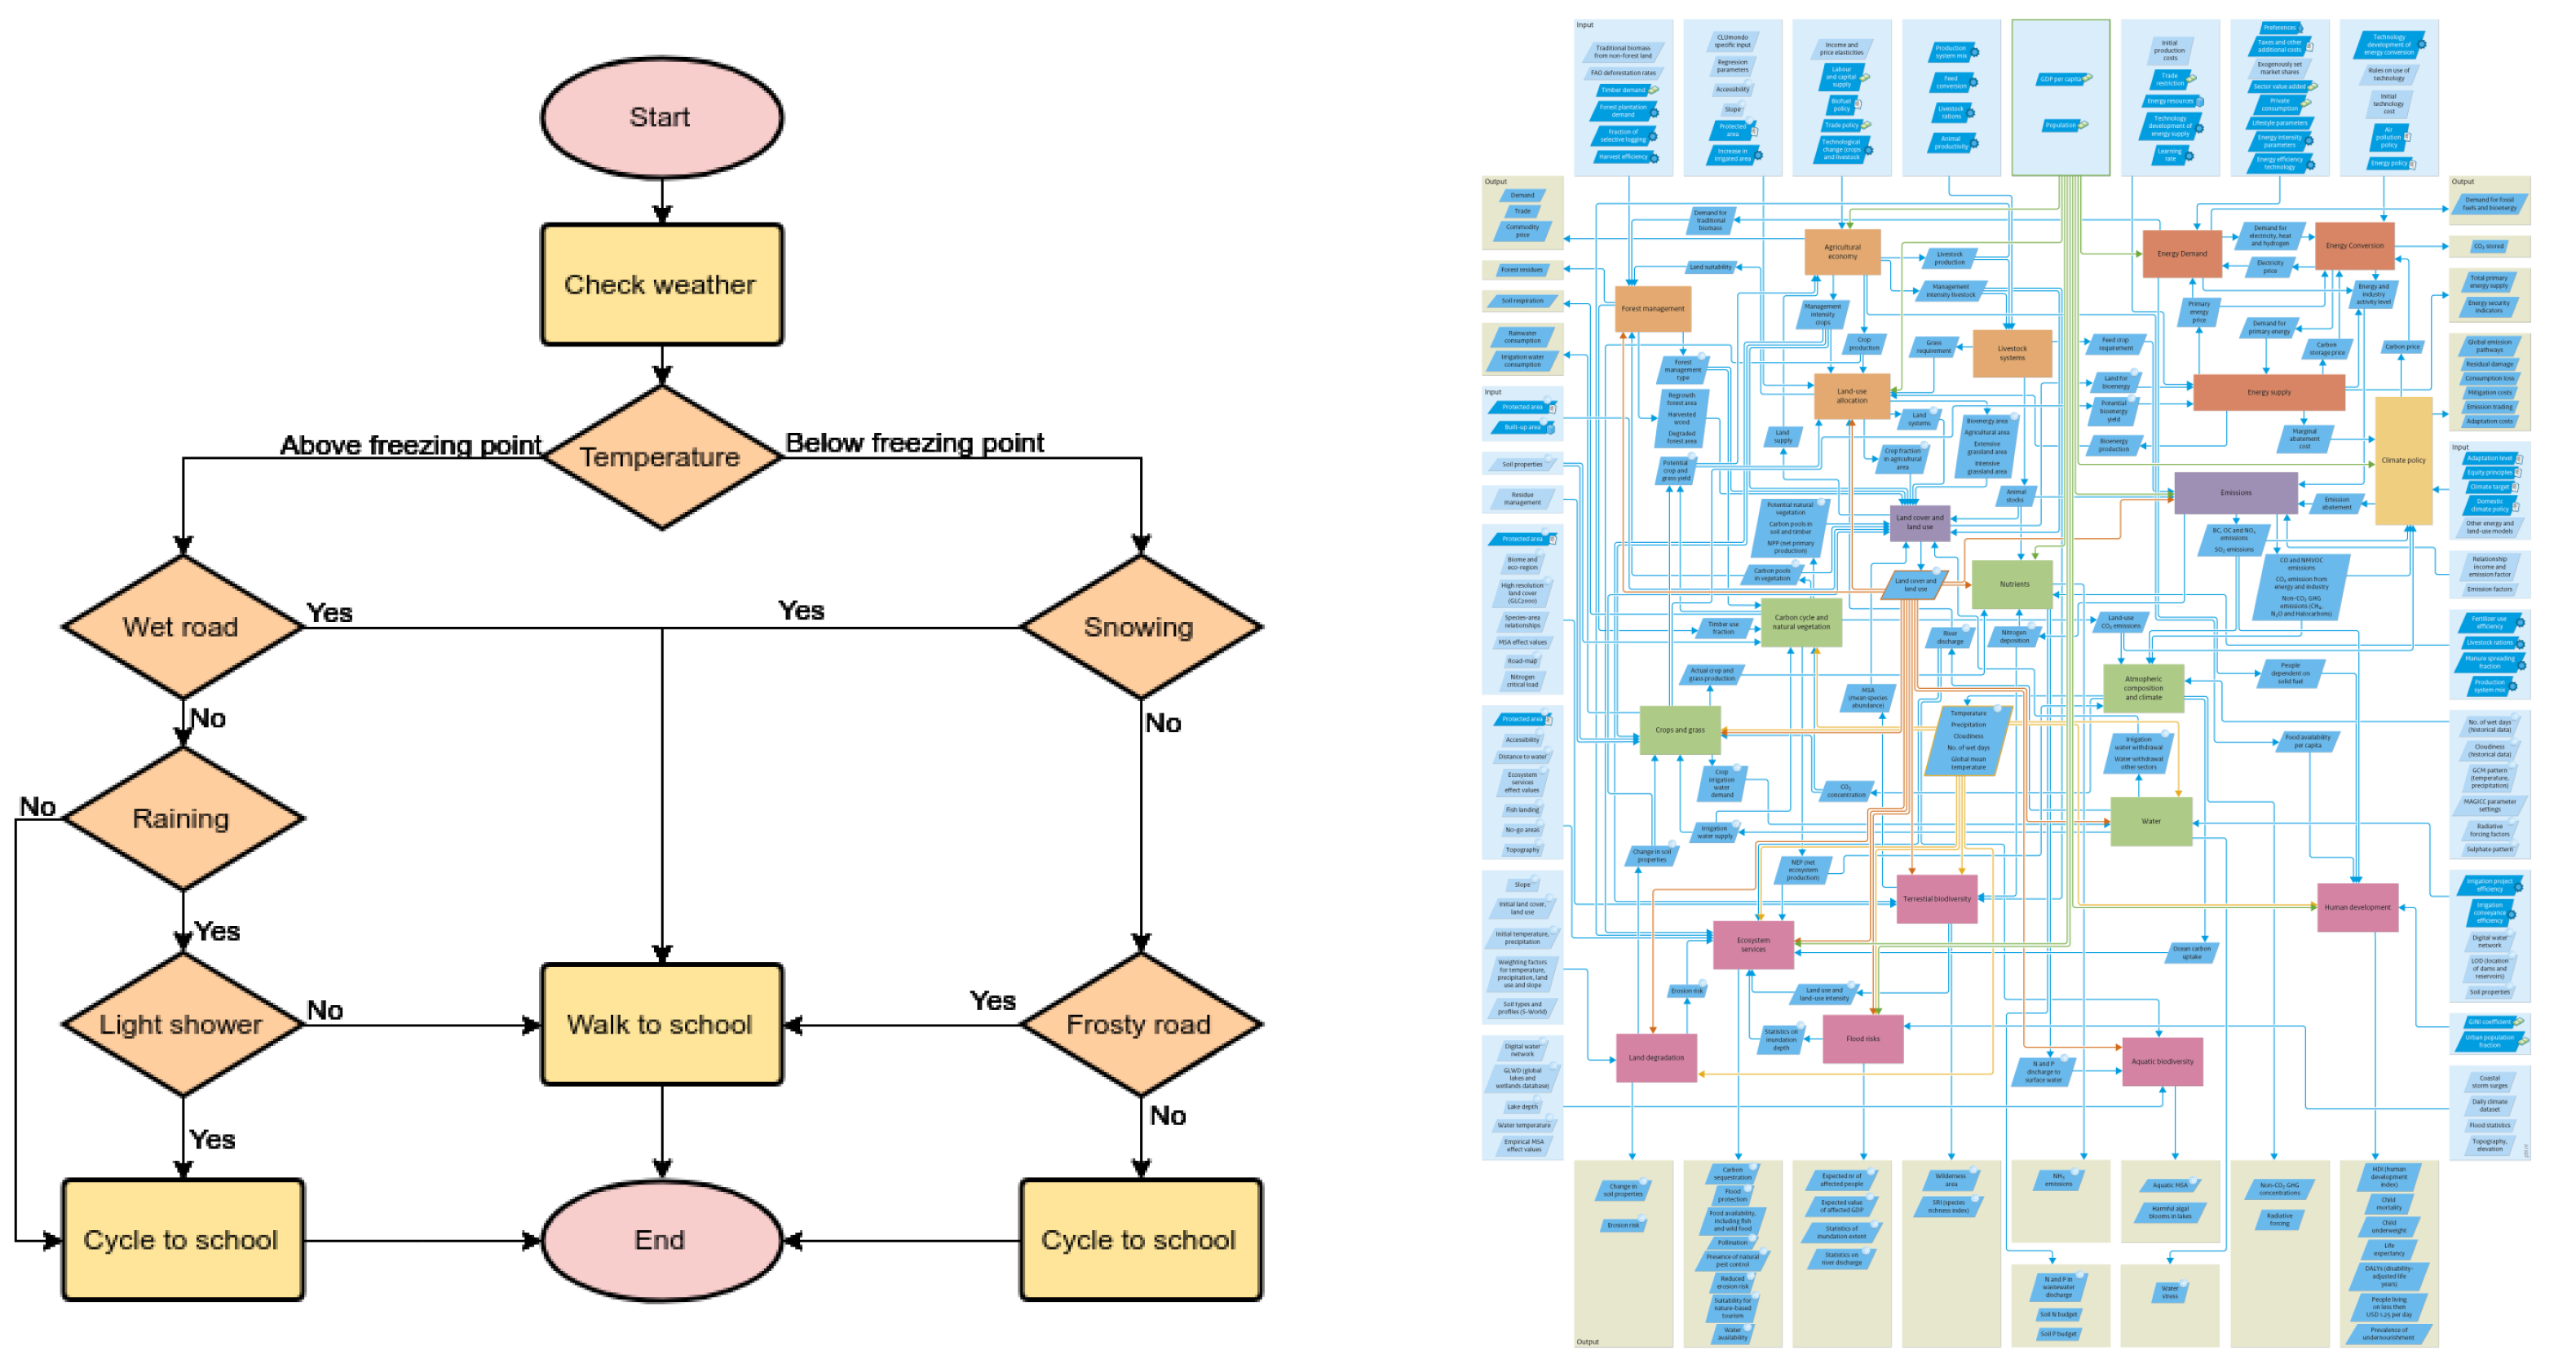
A workflow diagram is a visual representation of a business process. It is most commonly depicted using shapes and symbols in a flowchart style.
Workflow diagrams can help you understand how you contribute to a process. They also help you understand how your department interacts with other departments. Additionally, as a leader, they can help you see how students or employees complete a process.
The simple act of creating a workflow diagram is helpful on its own; however, you’ll see more benefits by analyzing your workflow. First, let’s discuss the components that make up a workflow diagram.
What are the three components of a workflow diagram?
The three basic components of a workflow diagram are input, transformation, output. Every step within a workflow is assigned one of these statuses.
1. Input
An input is something that completes or initiates a step.
For example, let’s look at a basic process like a student requesting to change their major. The input for this workflow may be when the student submits paperwork to apply for a change of major.
2. Transformation
A transformation is a change that occurs to result in an output.
Following along with our change of major request, the transformation would be administrators processing the paperwork.
3. Output
The output is the result of the input + transformation.
Using our example, the output would be approval for the student’s request to change their major.
At a very basic level, all processes can be reduced to these three components. Most processes, however, are a complex combination of inputs, transformations, and outputs. Even in the simplified version of a change of major request, we know there are many more actions that need to happen, such as approval from a variety of folks, a GPA check, and updating the student’s new major across campus systems. Next, we’ll talk about how to create a detailed workflow diagram.
How to create a workflow diagram
- Select a Process
First, select a process. You can create a workflow diagram for nearly any process in any department. Workflow diagrams are useful for processes that include many groups such as faculty, students, other departments, and external organizations.
It might be helpful to begin by thinking about a processing problem you’re having. Then select the process surrounding that issue for your first workflow diagram.
- Define Scope
After choosing your process, define the scope of your workflow diagram. The scope should be big enough to give you insights, but not so big that your diagram becomes too messy to understand. For reference, see the images below.
Select the beginning and ending points that make sense. Continuing with the change of major request, the starting point might be when the student submits the request, and the endpoint may be when the student is notified of the successful request.
- Create
Create your workflow diagram! Use your current knowledge of the process, and don’t worry about getting every detail just right. This chart is the first iteration of your diagram. Next, you’ll work with others involved in the process to build it out.
There are many tools you can use to build your workflow diagram. We’ve enjoyed using Zen Flowcharts, and you can test it out with a free trial.
- Gather Information
Gather information by communicating with each individual involved in the process. Ask questions to understand each individual’s role fully. You might begin with these questions:
- What is the end goal of this process?
- How long does this step or transition take?
- What activities are involved in this step?
- Do we deviate from this process? When and why?
- For decision-making steps, what information does the decision-maker need to complete their work?
Update your workflow diagram as you get input from those involved. By the end of this step, you should have a diagram that accurately displays the process.
- Analyze
Now that you’ve created your workflow diagram and gathered the information, it’s time to analyze it. Look for weak points, potential bottlenecks, and redundancies. It may help to categorize each step by how necessary the step is to achieve the end goal. For example, a grading scale like this is helpful: crucial, useful, nice-to-have, and unnecessary.
Next, look for ways to optimize the workflow. How can you cut out redundancies? Where can you shorten the length of time between steps?
Congratulations! You’ve created your first workflow diagram!
Enhance workflows in your organization
Now that you know how to create a workflow diagram and have tested this out in your own organization, you may find that many of your business processes are inefficiently managed. This often takes the form of manual processing via paper and PDF. Transformation steps might include manual data entry or emailing PDF documents.
The time between steps might be unreliable due to lost paperwork or forgotten documents housed in long email chains. A digital forms and workflow automation software can help you simplify and optimize paper- and PDF-based workflows to save time and valuable resources. Interested in learning more? Take a product tour of Kuali Build and see how it works!