Running a learning center is hard. With shoestring budgets, a part-time workforce, and excel skills a pre-requisite, you wear many hats.
This series of posts is designed to help. The key to thriving within these constraints, I believe, is analytical thinking. In the following content pieces, I will propose a data-driven framework for running a learning center. This will aid in identifying key areas of improvement to improve your center.
Why listen to me? I’m Ben, the CEO of a startup called Penji that helps college learning centers expand their impact. We’ve worked with 300+ learning centers to date, from every type of college imaginable. In this and future articles, I will work to package those experiences into a “master plan” for learning centers.
In this video and article, we break down a 3-part framework for measuring and improving your center over time.
A “funnel” is a useful concept from the business world. A funnel gets smaller as you go from top to bottom, and is an analogy for the journey your users take as they utilize your services.
You start with the full population - in our case, all students on campus. Your goal is to take someone from the top of the funnel to the bottom of the funnel.
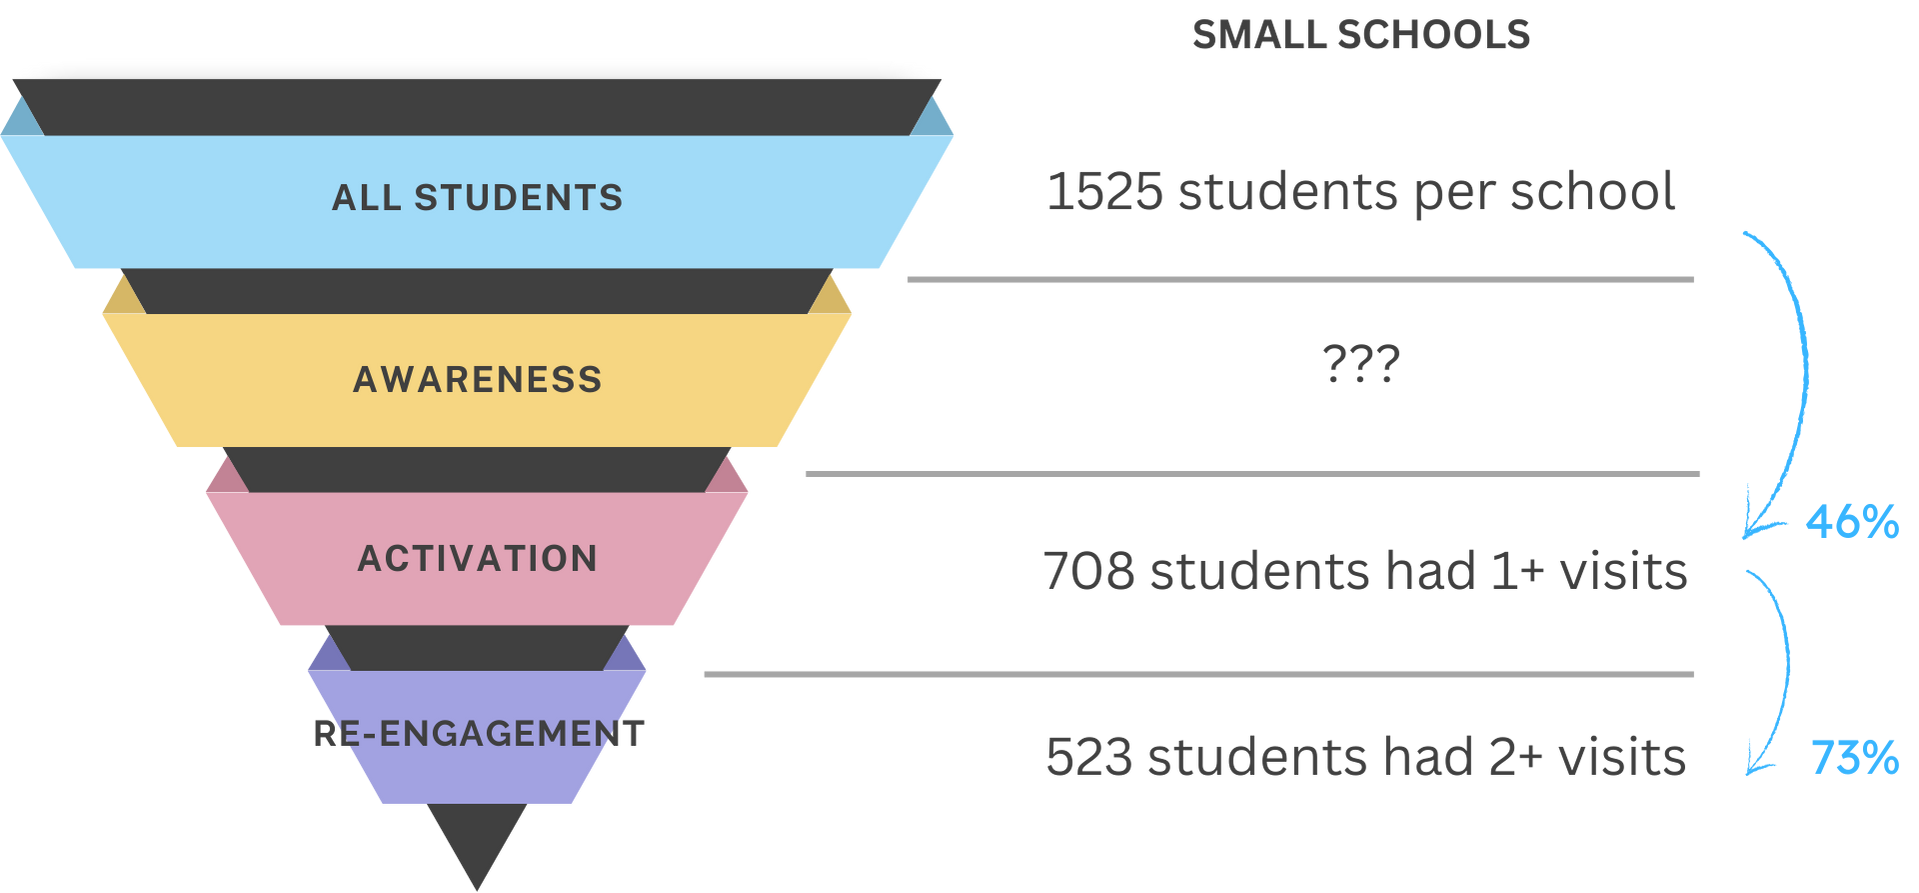
In the learning center context, students must:
For each step in the funnel, there is a conversion rate. In simple terms, conversion rates are the % of people that make it from one step to the next. For example, many people may be Aware of a service, but only some % of those will move on to trying that service for a first engagement. Our goal is to improve conversion rates.
Notice how the numbers shrink as you go down. Our jobs as managers are to minimize the fall off from one step to enough, or said another way, maximize the conversion rate between steps.
For each funnel step, we will want to (1) measure how we are doing and (2) work on improving that metric over time. As you begin to measure these metrics, it becomes useful to compare your center's metrics to other similar centers. That's why we prepared the report linked here:
Measuring awareness is actually the most challenging of the three steps. Instead of trying to understand how many students know you exist, most centers track what is in their control, and that is marketing.
Three methods to measure your marketing, from simplest to most complex:
This step is about reducing friction to booking a session and making your services seem worthwhile. A few ways you can work on this:
The metric we will track for this step (check out the funnel graphic again, above):
This final step occurs when students have a great experience and want to come back for more. This is controllable through:
So how can we improve our conversion rates? Simply tracking a metric for each funnel step is a great start. Check out this sample spreadsheet for how this will look:

Tracking these metrics term-to-term will give you a sense of which metric you’d like to work on improving next, and reveal interesting trends and deviations.
Once you begin measuring in a regular way, you’ll want to know how you can improve these metrics. Here are some of the upcoming playbooks we will share:
Awareness Playbooks
Activation Playbooks
Re-Engagement Playbooks
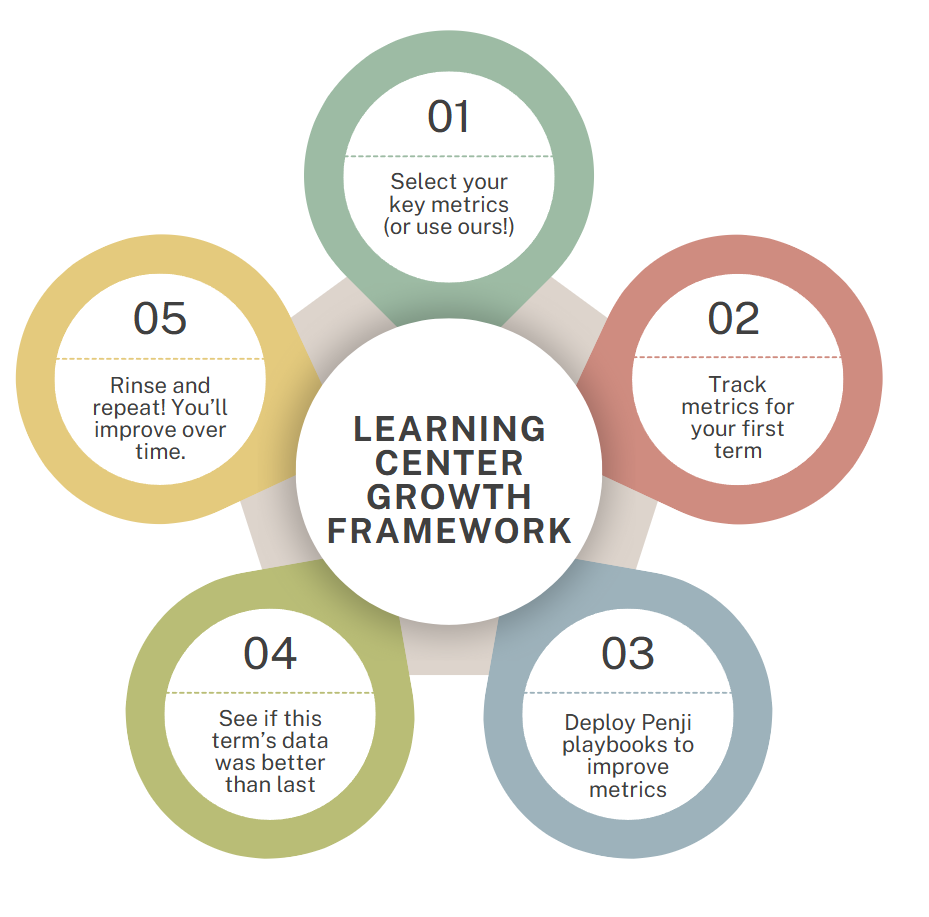
While it may seem like a lot, this process will feel easy as you settle into it.
The benefit? You will become increasingly clear on what your priorities should at any given time. This clarity is very nice!
Simply recording and reviewing this data will help a lot. A famous quote that holds true here:
That which is measured improves
You’ll find yourself having more ideas just with the simple act of observing your data over time. Future posts will dive into each metric, each funnel step, and give you how-to- guides on how to work on improving that step.
Would love to hear feedback on this piece! Email me at ben.h@penjiapp.com.
Ben Holmquist
CEO, Penji
ben.h@penjiapp.com
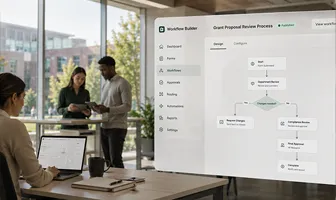
Discover how Kuali connects the work behind administration, research, compliance, IT, and more.
Explore Kuali solutions ->
Effective academic support depends on connecting students with the right resources at the right time. But as programs grow, disconnected scheduling tools, databases, and manual processes can make it difficult for staff to see the full picture. At Duke University, the Academic Resource Center (ARC) supports students through peer tutoring, learning consultations, and programs like SAGE (Student…
At the University of Central Missouri (UCMO), making academic support accessible means creating an experience that works for everyone involved. Students need an easy way to find help, tutors need flexibility to manage their schedules, and administrators need clear information to understand how their services are being used. Kuali Reach brings those pieces together. With an easy-to-use experience…

Working with hundreds of learning centers has given us a glimpse into what it takes to be successful and to grow engagement. In this article, check out the framework we've developed for learning center growth with a three-pronged approach focusing on Awareness (Marketing), Activation (First-Time Experience), and Retention. From impactful marketing tactics like orientation drives and faculty…


